81.8% probability of a BTC dip incoming
Month-end meets weekend – a potential double hit
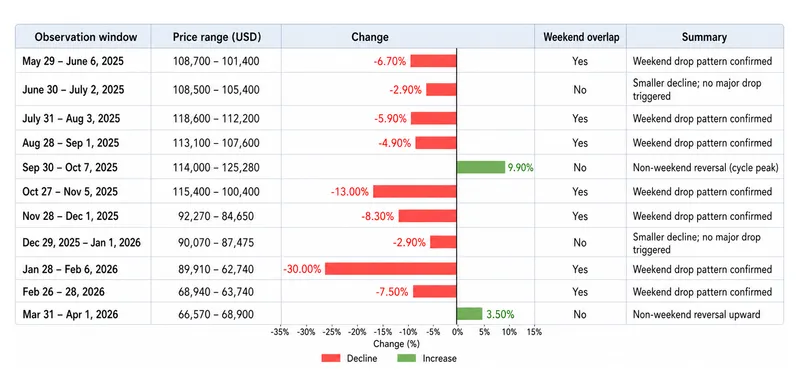
A backtest of BTC price action over the past year reveals a pattern that's hard to ignore: the market dips at month-end with 81.8% consistency. And when that transition overlaps with a weekend, the hit rate goes to 100%.
Here's what the data shows.
What the BTC data is telling us
Pattern 1: Month-end = selling pressure
Over the past year, BTC fell ~82% of the time around month-end. The reason is simple: institutions de-risk, settle positions, and liquidity thins, making prices easier to move.
Pattern 2: Weekend overlap amplifies the effect
When month-end hits a weekend, BTC dropped every time, with moves over 4%. This is due to lower liquidity and fewer market participants which mean sell pressure hits harder.
Pattern 3: Weekdays soften the effect
If the transition happens on weekdays, the edge fades. Price action is more balanced at around 50% between up and down moves, and any declines tend to be smaller thanks to stronger liquidity and participation.
Disclaimer: This article is for informational purposes only and does not constitute financial or investment advice. Historical patterns do not guarantee future results. Always do your own research before trading.