


Trade Smarter and Win Big! Your Path to Glory in the NewDegen 2023 On-Chain Trading Competition
The NewDegen 2023 On-Chain Trading Competition is now in full swing! Led by Bitget Wallet in collaboration with renowned project partners, media outlets, and influential figures in the crypto space, the NewDegen 2023 On-Chain Trading Competition is a global DeFi extravaganza that boasts attractive cash prizes of up to 100,000 USDT, and exclusive "Medal of Honor" Soulbound Tokens!
What are you waiting for? Register here!
In this article, we will be going through the various features of Bitget Swap, your ultimate companion paving the path to victory.
Using Bitget Wallet for the first time? Click here to learn all about Bitget Wallet and its various exciting features!
Accessing Token Lists
To access token lists and other key information to decide which token to buy, simply tap on "Swap" at the bottom of your Bitget Wallet homepage, where you will be immediately directed to the swap dashboard. On this page alone, you can easily view important data such as price movements from major mainnet tokens such as BTC, ETH, and BNB.
Not sure where to start? Browse the comprehensive token lists integrated on your swap dashboard by scrolling through the sidebar. You may also sort the token lists via various methods, such as changes in price, current price, and 24h volume.
Here are some notable lists that you may keep your eye on:
Favorite: You may add tokens that you are currently watching to your "Favorite" list, making it easier for you to locate them. This can prove useful if you need to make quick swaps on-the-go, or if you simply want to refer to the token's chart and statistics.
HOT: Tokens that are currently trending and experiencing surges in trading volume are listed here. This can be a good starting point if you do not already have a token in mind to trade!
New: Tokens from newly-launched projects are listed under this tab.
Top Gainers / Top Losers: As the name suggests, these tabs display tokens that have either experienced significant price rallies or dips. These lists can come in useful when executing your trading strategy.
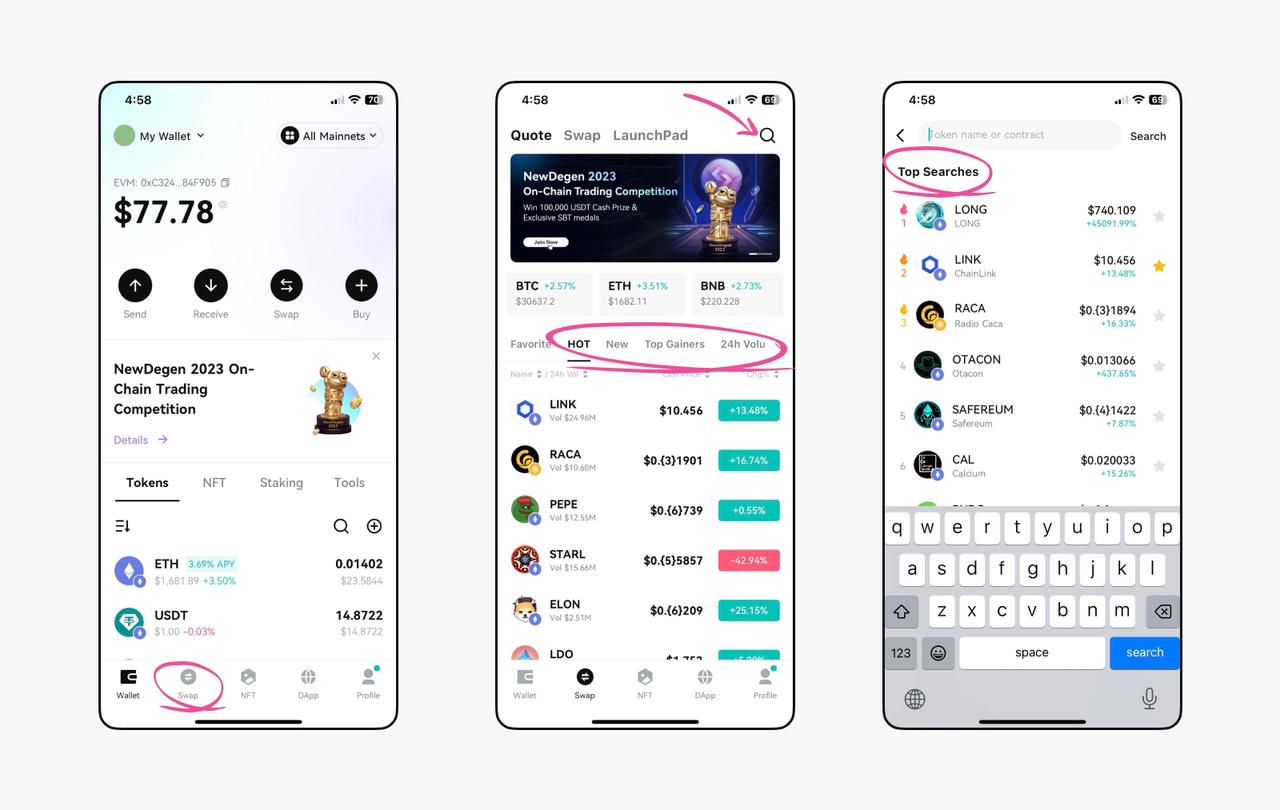
If you already have a token in mind that you wish to trade or add to your "Favorite" list, simply tap on the magnifying glass icon at the top right corner of your screen, and key in the token's name in the search field. You may also view the list of top-searched tokens on this page, which you may also choose to explore to diversify your options.
Token Profile Dashboard
To view more about a specific token's information, simply tap on it and you will be brought to the token's profile page, featuring a comprehensive candlestick chart display, specific data points such as 24h prices and trading volume, as well as analytical chart overlays.
Let's now explore and break down some of the most vital information you should be viewing before trading a token.
Token 24h Trading Statistics
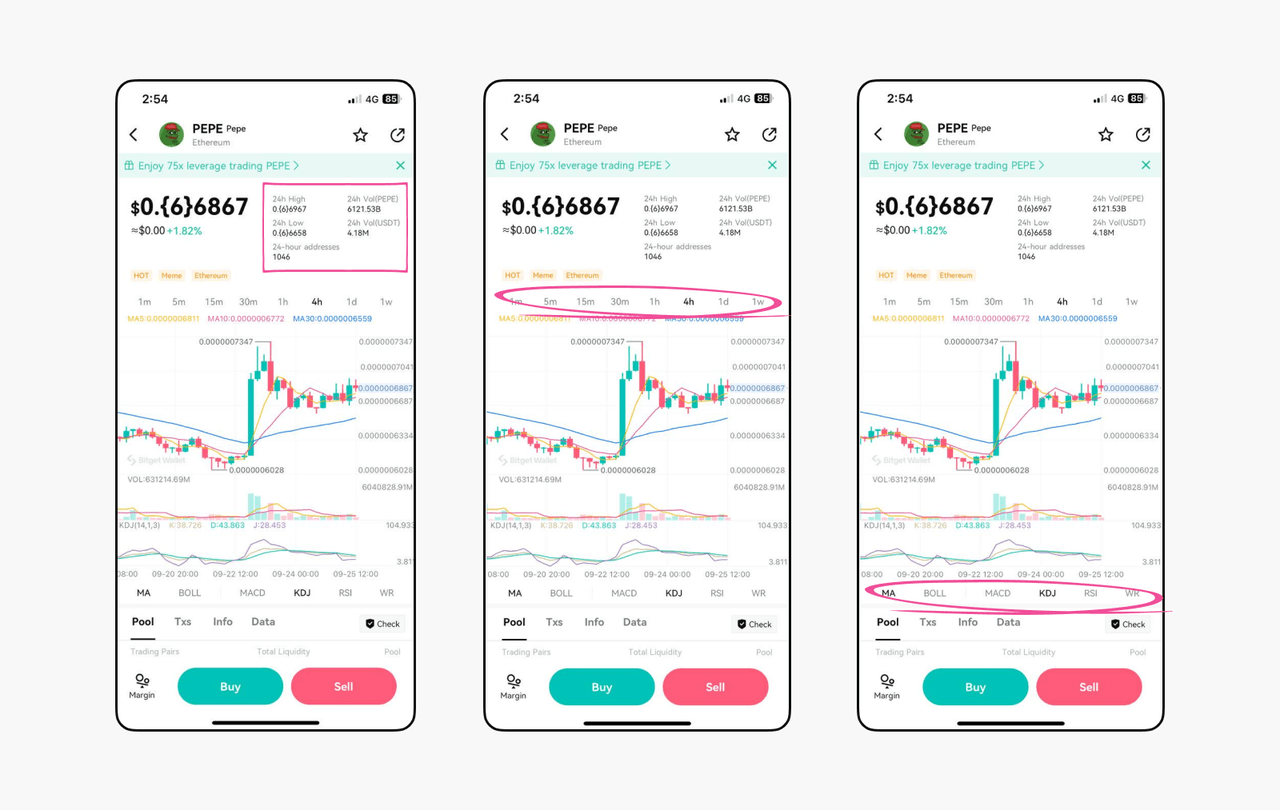
Found in the top right corner of the token's profile page, you may view important pieces of information pertaining to the token's trading activity, such as its 24h trading volume and 24h addresses.
Trading Volume: Trading volume plays a crucial role in the cryptocurrency market and can provide valuable insights for you. A high trading volume suggests strong interest and active trading in a token, while low volume may indicate limited interest and reduced trading activity.
24-hour addresses: The number of unique addresses involved in trading a coin is a key factor. A higher number of participants is generally favorable, while dominance by a few large players can be a red flag, potentially indicating market manipulation or lack of decentralization.
Use these trading statistics to help you make the most informed trading decision!
Candlestick Chart Viewing
Bitget Swap features comprehensive and useful candlestick chart displays. You may opt to adjust the time period for the candlestick chart to observe the price pattern of the token from a different perspective as well, from anywhere between the past 1 minute to 1 week.
Additionally, you may also opt for technical analysis overlays on the candlestick chart by selecting the relevant tabs below the candlestick chart. The main indicator settings you ought to be concerned about would be MA and BOLL, which will provide graphical line overlays on the candlestick chart to assist you in your trading decisions. Supplementary indicators such as MACD, KDJ, and RSI can be used on your selected indicator setting to add further graphical illustrations based on your preferences.
Confused at what these indicators mean? Don't worry, here's a summarized list of the key points you should know for each indicator setting.
MA: A Moving Average (MA) is a way to track a cryptocurrency's price trend smoothly based on past price data over a set number of days. Bitget Swap automatically deploys MAs from two periods: a 5-day MA (MA5), and a 10-day MA (MA10). Traders typically use MA to understand market trends. If a token's price stays above its set MA for a while, it might be experiencing a bull rally. If the price goes below the MA, it could signal a sell.
BOLL: Bollinger Bands are a tool for assessing market volatility, identifying overbought and oversold conditions. They consist of three lines: a middle line (SMA), an upper band, and a lower band. When the price approaches the upper band, it suggests the asset might be overbought. Conversely, when the price nears the lower band, it implies potential oversold conditions.
MACD: Moving Average Convergence Divergence (MACD) helps gauge an asset's momentum. Divergences between the MACD and price action can reveal insights into the trend's strength. If the price achieves higher highs while the MACD records lower highs, it may signal an impending market reversal.
There are other indicators available on Bitget Swap as well, including Relative Strength Index (RSI) and Stochastic Oscillator Indicator (KDJ). These indicators can help to provide some crucial insights via technical analysis, and can even prove to be the deciding factor in making the right trading call at the right time.
Viewing Token Statistics
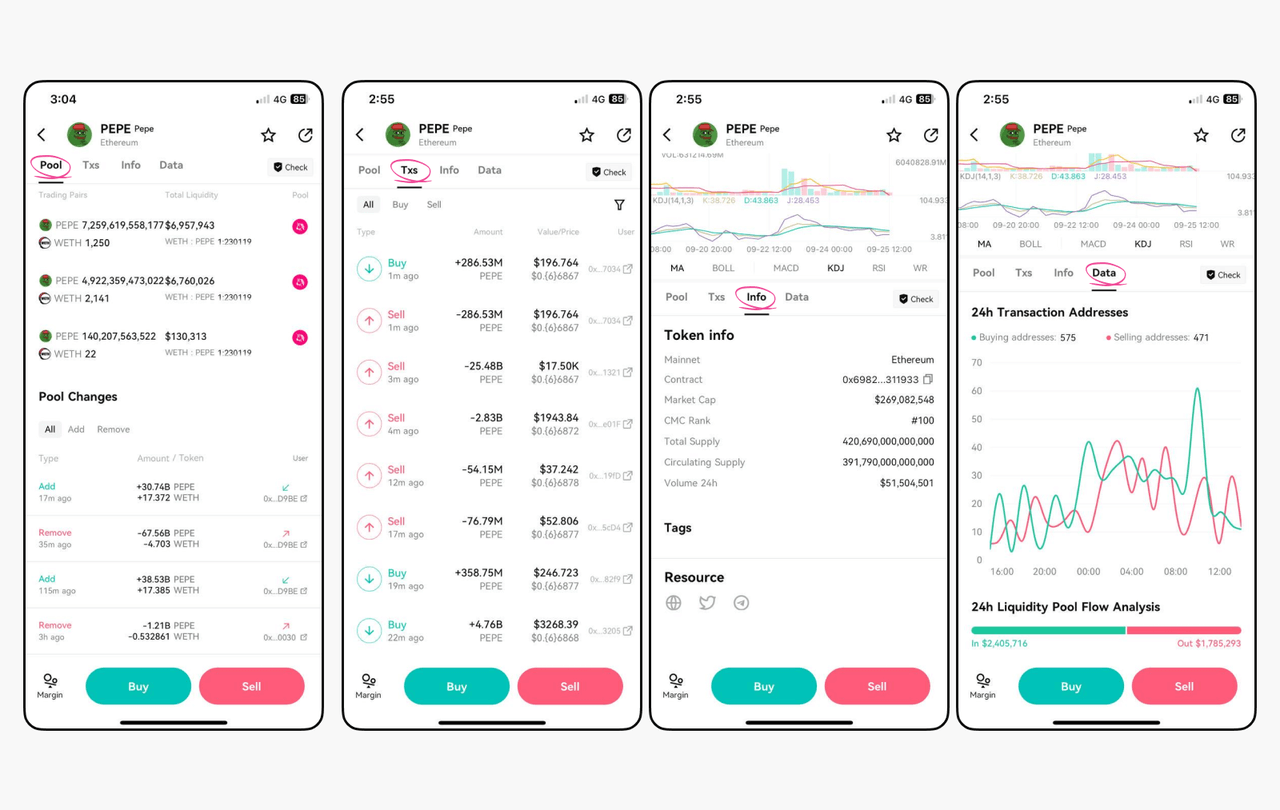
To view a token's statistics, simply scroll down the token's profile page. There are 4 primary tabs that will be of use to you in your trading journey - Pool, Txs, Info, and Data. In this section, we will be going through a brief overview of each tab.
Pool
The "Pool" tab displays the overall changes made to the token's liquidity pool. Additions and removals from the token's liquidity pool are displayed here. Typically, if a token holder adds liquidity, it suggests that he prefers to be a liquidity provider to earn interest instead of selling the token at the current price. As such, net increases in a token's liquidity during a price rally can indicate that holders are confident about a continuous bullish movement, as they stand to gain more interest as a liquidity provider.
Txs
You may easily view the token's transaction history under the "Txs" tab. You may opt to apply filters such as "Buy" or "Sell" to streamline your viewing experience. Additionally, you may also tap on the filter icon to search if a specific address has interacted with the token, or view transactions of a set price range. This can help you easily detect whale or smart money movements.
Info
View the token's overall information under the "Info" tab. Here, important information about the token can be found, including its Market Cap, Total Supply, Circulating Supply, and 24h Trading Volume.
Market Cap: Market Capitalization, or Market Cap, refers to the dominance and popularity of the specific token, and is determined by multiplying the current price with the circulating supply.
Total Supply: The total number of such tokens in existence. This includes tokens that have been minted, created, or generated since the token's launch (including locked tokens or tokens held in reserve) but excludes tokens that have been burned or destroyed.
Circulating Supply: The total number of tokens that are currently available and are in active circulation, excluding locked tokens or tokens held in reserve.
Data
Under the "Data" tab is where you will be able to find graphical representations of the token's activity, including changes to 24h transaction addresses, 24h liquidity pool flow analysis, and 24h liquidity pool data analysis. The 24h liquidity pool flow analysis graph also categorizes liquidity flow according to movement size: Whale, Shark, and Turtle, in decreasing order. This can be a helpful tool for you to visualize important aspects of the token's overall performance, as well as provide key data points such as net liquidity inflow, which can help you make informed trading calls.
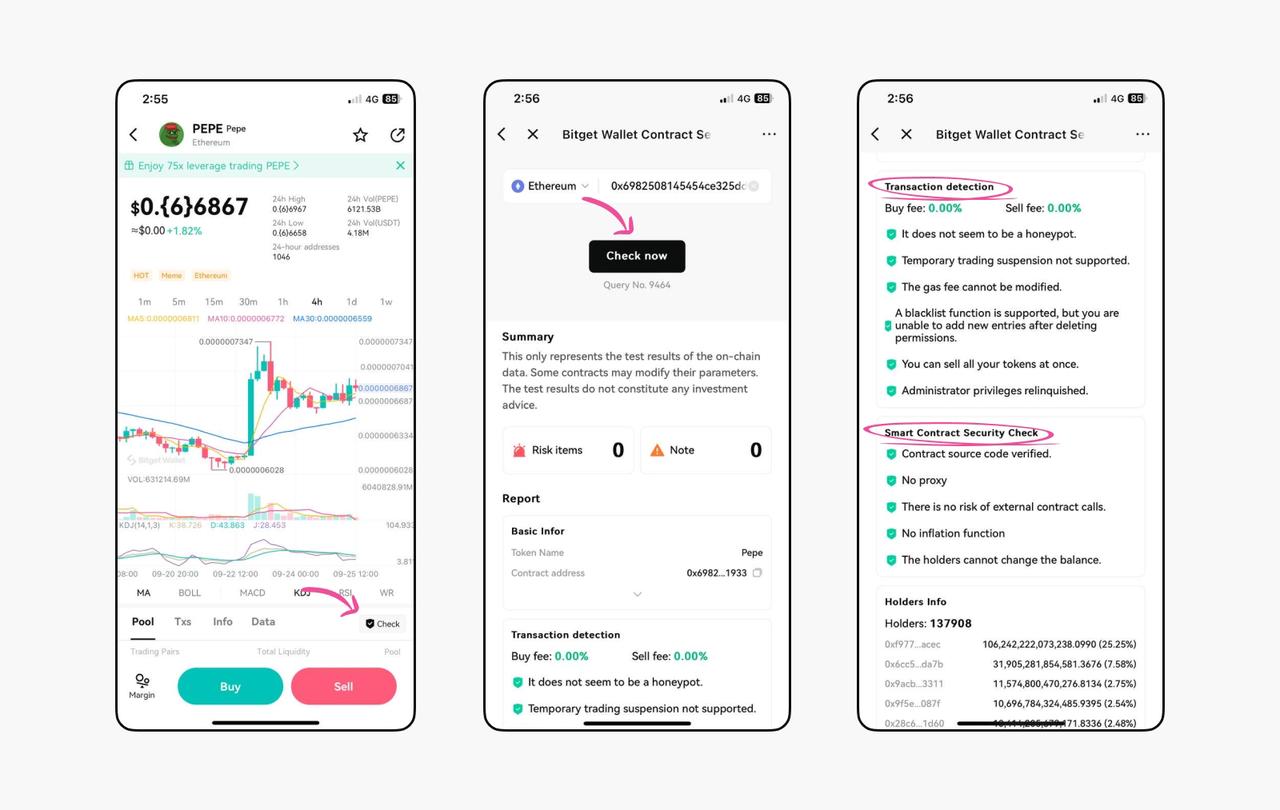
Viewing Token Security Level
At Bitget Wallet, we place a strong emphasis on user safety. Bitget Swap supports a staggering 255,400 tokens across 90 blockchains, and as such, it is important to thoroughly screen a particular token before making a purchase. Bitget Wallet integrates GoPlus security archives and databases to introduce cutting-edge threat detection alerts to preemptively keep users safe from malicious tokens and contracts. To view the security analysis of a particular token, follow these 3 simple steps:
Step 1: Tap on "Check" on the token's profile page.
Step 2: If you have a specific contract address that you wish to screen, key it into the search field and select the corresponding mainnet. Otherwise, proceed to Step 3.
Step 3: On the same interface, scroll down to view the overall security screening that Bitget Wallet has undergone for the token with the help of GoPlus security archives. Important information, such as associated buy / sell fees can also be found here.
It is important to note however, that users should still undergo their own due diligence and research into a token's security background before committing to a purchase. Bitget Wallet's security detection feature should not be relied upon as the sole determinant for gauging a token's risk level.
Closing
This concludes our comprehensive guide on how you can make smart trading decisions using Bitget Wallet! What are you waiting for? Rev your engines, get set, and achieve victory in the NewDegen 2023 On-Chain Trading Competition! All the best to all participants, and remember that fortune always favours the brave.
Faster Trading, Better Assets. Bitget Wallet, Your Web3 Trading Wallet of the Future.
Follow Bitget Wallet to stay up-to-date with all of our latest events, findings, and promotions, and let Bitget Wallet be your premier gateway into the Web3 space.
For more information, visit: Website | Twitter | Telegram | LinkedIn | Discord
For media inquiries, please contact: [email protected]

 No data found.


